
Are Home Prices Rising or Falling in Cedar Park, TX?
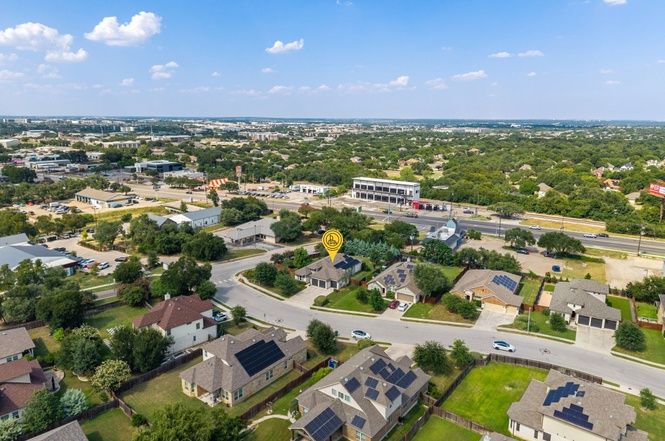
Cedar Park, a city near Austin, TX, is seeing modest price growth even as much of the Austin metro cools. Here's what the data shows and what buyers and sellers should keep in mind.
The National Picture
As of the 3 months ending August 2026, the national median home price is about $399,000, up 2% from a year ago. Affordability is actually improving — the typical U.S. household earns about $88,000 and now spends roughly 34% of income on housing, down from about 36% a year ago. Around 20% of listings have had a price drop, there are about four months of supply nationwide, and homes spend a median of 50 days on market.
Home Prices in the Austin Area
Across the Austin metro, the median sale price is about $414,000, down roughly 6% from last year. The typical metro-area household earns around $109,000 and puts about 34% of that toward housing, down about 2 percentage points from a year ago. Austin buyers are seeing real affordability improvement as prices come down and incomes hold steady.
Steady Growth in a Buyer-Friendly Metro
Cedar Park's median sale price rose about 4% year over year to $507,000, bucking the broader Austin-area downtrend. About 13% of homes sold above list price, and the typical sale closed at about 98% of asking. Still, nearly 45% of active listings have had a price cut, and homes sit on the market for a median of 49 days. Nearby Brushy Creek held roughly flat at $525,000, while Leander's median of $428,000 barely budged.
Why Are Prices Rising in Cedar Park?
Demand in Cedar Park has kept pace with supply. Pending sales rose about 6% from last year while active listings dipped 2%, keeping the market at 3.8 months of supply. New listings grew 5%, but buyers have absorbed them steadily. That balance has allowed prices to edge higher even as sellers in most surrounding cities have had to cut their asking prices.
| Neighborhood | Median Price | Price YoY | Price Drops | Months of Supply |
|---|---|---|---|---|
| Cedar Park ★ | $507,164 | +3.9% | 44.8% | 3.8 |
| Buttercup Creek | $527,246 | +24.1% | 38.3% | 3.6 |
| Ranch at Brushy Creek | $824,602 | -7.3% | 55.4% | 3.5 |
| Brushy Creek | $524,653 | +0.9% | 49.1% | 3.4 |
| Dripping Springs | $480,132 | +3.3% | 41.3% | 3.3 |
| Leander | $427,717 | +0.6% | 47.5% | 5.0 |
Limited to neighborhoods with at least 10 home sales in the period.
All data comes from Redfin and represents a three-month rolling average ending August 2026. This article has been generated, in whole or in part, using generative artificial intelligence (AI) technology, with input from Redfin head of economics research Chen Zhao. While efforts have been made to ensure the accuracy and reliability of this information, you should independently verify all data, facts, and citations contained in this article before relying on it for any purpose. This information is not a substitute for advice from a real estate agent, financial advisor, or other licensed professional. Check the Redfin Data Center for additional in-depth housing market data.
Categories
Recent Posts





Redfin Principal Agent License ID: TX #673159
+1(512) 969-7530 | gabriel.recio@redfin.com